
Imagine – you need to make a decision about keeping or closing a franchise store in a region. You are a data-driven decision maker and prefer to analyze all the data points before arriving at any decision.
You requested data on –
- Sales performance & growth
- Sales team performance
- Conversation rate
- Average deal size
- Total sales
What would you prefer to look at?
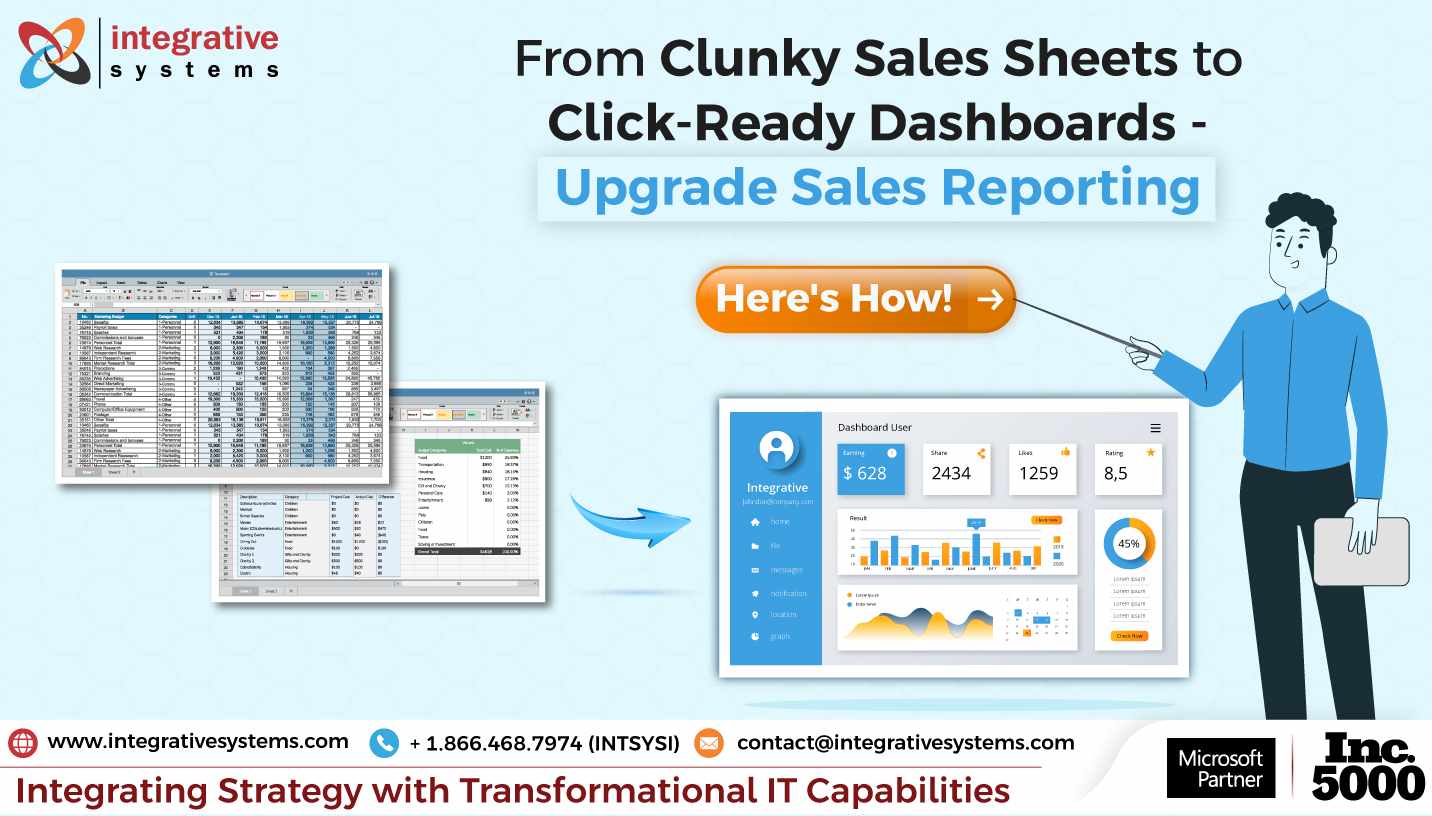
A bunch of spreadsheets?
A customized Power BI sales dashboard?
In today’s data-rich business landscape, sales leaders must make decisions quickly – given the availability of data on every single aspect of sales.
From identifying rooted patterns to predicting future trends, Power BI sales dashboards help you do more than simply tracking KPIs.
Power BI dashboards offer real-time visibility into your sales pipeline and take proactive actions, not reactive.
No matter if you’re looking after a retail enterprise, an eCommerce store, or a B2B company, sales dashboards in Power BI deliver insights that transform your sales function, from reactive to proactive.
This blog explores how Power BI for sales enables sales teams to close more deals, faster—through dynamic dashboards that do more than just visualize data.
We’ll walk through what makes the best Power BI sales dashboards so effective, and how you can design one that fits your business needs precisely.
Let’s dive in.
What do Power BI Sales Dashboards Offer?
Sales teams thrive on clarity.
Whether it’s daily performance, quarterly targets, or annual revenue forecasting—clarity drives confidence.
And yet, many sales teams still rely on siloed reports, manually updated spreadsheets, or outdated BI systems to inform their decisions.
This often results into –
- Delayed reporting cycles
- Decreased visibility into granular KPIs
- Inconsistent metrics across departments
Power BI bridges these gaps by offering fully customizable, real-time, and interactive sales dashboards.
Here’s what sets a Power BI sales dashboards apart –
Unified View of Sales Performance – They consolidate data from CRMs like Dynamics 365, Salesforce, or HubSpot along with marketing and operations data to offer you a 360-degree view of the sales funnel.
Visual Storytelling – They move beyond numbers and tell stories with visuals—sales conversion funnels, performance heat maps, regional comparison charts, and product-wise revenue charts, to help you read trends at a glance.
Actionable Alerts and Drilldowns – They allow you to drill down from high-level overviews to SKU-level insights, to truly identify & understand what’s working and what’s not, in real time.
Forecasting and Predictive Analysis – They enable you to go from descriptive to prescriptive insights with AI-powered forecasting and What-If analysis for territory planning, revenue prediction, and pipeline optimization.
When designed effectively, the best Power BI sales dashboards don’t just report—they guide. They bring together visual clarity and data confidence in a way that inspires proactive selling, every day.
From an operational standpoint, whether you’re building a Power BI dashboard for sales reps, sales managers, or C-suite executives, the intent remains the same—equip each stakeholder with insights they can act on instantly.
And that’s where thoughtful dashboard design comes into play.

Why Choose Power BI for Sales?
For years, sales teams have operated in fragmented ecosystems—CRMs, Excel sheets, ERP logs, scattered reports, and verbal updates. While each tool has a purpose, they often create a bigger problem – disjointed visibility.
That’s where Power BI sales dashboards step in.
They don’t just gather data—they harmonize it.
With Power BI, you can bring together numbers from Salesforce, Zoho, Microsoft Dynamics 365, HubSpot, Shopify, or any ERP system into one cohesive interface.
The result? A single source of truth for sales.
And this unified visibility is a game-changer.
Sales reps can track progress against KPIs in real time. Managers can analyze customer journeys, pricing patterns, and pipeline bottlenecks in one click.
Leadership can forecast revenue with precision using Power BI sales forecasting dashboards that rely on historical trends and predictive modeling.
The true value of sales dashboards in Power BI isn’t just clarity—it’s speed. Speed in identifying dips. Speed in spotting upsell opportunities. Speed in decision-making.
When teams stop chasing numbers and start interacting with insights, sales become proactive, not reactive.
Next, let’s understand how to design the best sales dashboards in Power BI.
How to Design Sales Dashboard in Power BI?
Power BI sales dashboards bring you more than just pretty charts and visualizations.
They bring you clarity.
They bring you context.
They bring you data stories.
Thinking, “How do one design the best Power BI sales dashboards?”
Here are some key principles to consider for creating effective Power BI sales dashboards.
Focus on What Matters Most
Your dashboard shouldn’t try to do everything – they’re not meant to.
A well-designed sales dashboard in Power BI prioritizes core KPIs based on the viewer’s role –
- For Executives – Revenue growth, conversion rates, sales forecasts, YoY comparisons
- For Managers – Pipeline stages, win-loss analysis, team performance breakdowns
- For Sales Reps – Daily activities, individual targets vs. achievements, lead progression
Each of your viewer deserves a tailored view – one that removes the noise and displays the most relevant actions.
Visual Hierarchy and Layout
Use intuitive layout strategies to guide the viewer’s eye from high-level metrics to detailed breakdowns.
- Start with KPIs at the top
- Support them with visuals like bar charts, line graphs, maps, or scatter plots
- Reserve filters, slicers, and user controls in a consistent panel (left or top-aligned)
This helps your users identify trends and investigate areas that need attention.
Color with Intention
Power BI sales dashboard design thrives on consistent and meaningful color schemes.
You can use –
- Green for growth
- Red for underperformance
- Shades to differentiate product categories, regions, or time frames
Avoid rainbow charts – color should enhance interpretation, not confuse it.
Incorporate Custom Visuals for Advanced Needs
Power BI offers advanced visuals like Sankey diagrams (for lead flow), sunburst charts (for product hierarchies), and radial gauges (for target tracking) that bring complex sales scenarios to life.
Want to visualize multi-channel eCommerce performance or retail sales by geography and SKU? A well-crafted custom visual can turn complex reports into intuitive, decision-ready dashboards.
Mobile-Optimized Dashboards
Sales don’t stop when you’re away from your desk.
Designing responsive layouts for mobile ensures that your users can access most critical KPIs on the go, via Power BI mobile app.
Great sales dashboards don’t come off-the-shelf. They’re built. And when they’re built right, they become your sales team’s daily compass.
Already liking it all that a Power BI sales dashboard delivers?
One in action will change your sales trajectory forever.
Don’t have a team of full-stack Power BI developers to build Power BI dashboard for sales?
We can do that for you.
We extend your in-house Power BI expertise by becoming an extension of your team.
We help you build the best Power BI sales dashboards.
We train your team to get up-to-speed.
We support you every step of the way.
Here’s how we do it for you!
Designing Best Power BI Sales Dashboard – The Integrative Systems Way
At Integrative Systems, we don’t just build Power BI dashboards—we design sales intelligence environments that empower your team to think fast, act smarter, and sell better.
Because in sales, data isn’t just for tracking. It’s for transforming strategy into measurable outcomes.
The best Power BI sales dashboards do more than display metrics—they tell a story, answer critical business questions, and guide decision-makers through the right actions at the right time.
- What products are shaping customer loyalty?
- Are we closing enough deals this quarter?
- Which regions are underperforming?
- Where can the next upsell happen?
Here’s how our Power BI experts at Integrative Systems bring these dashboards to life.
1. Clarity-First KPI Framework
We work closely with your team to define a KPI architecture tailored to your goals—think sales pipeline velocity, revenue by territory, opportunity win rate, customer acquisition cost, and CLV.
No clutter. No guesswork.
Just precise metrics that drive results.
2. Personalized Dashboards for Every Sales Role
A VP of Sales needs strategic visibility.
A frontline rep needs daily momentum.
Our team designs role-based Power BI dashboards that deliver the right insights to the right people—using row-level security, bookmarks, and interactive navigation.
3. Visuals That Reflect Business Logic
The goal isn’t to design aesthetically appealing dashboards – but to design dashboards that are interactive & intuitive.
- Bar charts to track progress against quotas.
- Maps to visualize regional performance.
- Funnels to monitor conversion stages.
- Cards for real-time sales KPIs.
Every visual we build is rooted in how your sales team thinks, speaks, and sells.
4. Interactivity that Inspires Exploration
Power BI’s interactivity is powerful—and we harness it fully.
From slicers by product category to drill-throughs by rep, we help your users navigate data, uncover patterns, and find answers on their own terms.
5. Optimize for Mobile and Real-Time Use
Whether in a boardroom or on the go, your dashboard should be responsive and dynamic—keeping decision-makers connected to real-time sales performance.
Our team of Power BI experts help transform the most complex datasets into product sales dashboards in Power BI that ignite strategy and spark growth.
Whether it’s a product sales dashboard for retail, a performance dashboard for enterprise sales, or a sales forecasting model for ecommerce – our Power BI experts help you create Power BI sales dashboards that don’t just inform – they accelerate.
Next, let’s understand how powerful sales dashboards Power BI contribute to the bottom-line revenue.
What are the Benefits of Power BI Dashboard for Sales?
In the fast-paced world of sales, data isn’t just a record—it’s your edge.
It’s what transforms guesswork into game plans. With Power BI, that edge becomes visible, accessible, and actionable.
We help you turn raw sales data into insightful narratives that spark confident, revenue-driving decisions.
Real-Time Visibility That Keeps You Ahead
Imagine a sales dashboard that updates as your business evolves—offering live snapshots of your most critical metrics.
With Power BI for Sales, that’s not just possible—it’s practical.
Here’s how we help you stay in control –
- Daily Sales Trends – Spot momentum shifts early and fine-tune your approach.
- Top Product Performance – See what’s selling, where, and why—instantly.
- Regional Classification – Identify which areas are doing great in sales, and which areas need strategic support.
Power BI sales dashboards offer real-time visibility into sales trends & patterns – enabling your sales teams to adapt quickly to changing customer needs, grab opportunities to cross-sale, and eliminate data blind spots.
Sales Forecasting That Fuels Smart Planning
Forecasting isn’t about speculation—it’s about preparation.
Using Power BI’s predictive engine, we help you –
- Dive deep into historical patterns to spot reliable trends.
- Factor in seasonality to anticipate predictable swings.
- Run what-if analyses to explore outcomes before they unfold.
You don’t just plan better. You plan proactively, with foresight baked into every sales initiative.
Stronger Sales-Marketing Synergy
When sales and marketing work from the same data playbook, strategy becomes seamless. Power BI bridges the gap by making shared visibility the norm, not the exception.
With our help, you’ll –
- Track lead-to-close performance and fine-tune campaigns in real-time.
- Measure campaign ROI in actual revenue terms—not just impressions.
- Uncover customer segments with the highest lifetime value.
The result? Sales and marketing move in sync—driven by insight, not instinct.
Why Integrative Systems is Your Ideal Power BI Partner?
Choosing the right partner isn’t just about implementation—it’s about collaboration, clarity, and continuous progress.
At Integrative Systems, we don’t just build dashboards.
We build confidence in every sales decision you make.
Sales Expertise Built into Every Solution
We understand that sales success isn’t about more data—it’s about the right insights, presented the right way.
Here’s what sets us apart –
- Outcome-driven KPIs – We frontload revenue-driving KPIs
- Prioritize Clarity – We build dashboards offering actionable insights
- Insights With Impact: We turn static data into meaningful direction
Solutions Built Around Your Sales Ecosystem
No two sales teams operate the same way—and that’s exactly why our dashboards don’t either.
We offer –
- Scalable architecture so your solution grows as your business scales
- Tailored dashboard design that reflects your sales goals and workflows
- Smooth Integration with your existing CRM, ERP, or eCommerce platforms
With us, Power BI becomes a natural extension of your sales environment—not a separate tool.
Support That Keeps You Moving
We’re with you beyond go-live, ensuring your team stays empowered and your dashboards stay relevant.
Count on us for –
- Proactive, on-demand support and issue resolution
- Periodic enhancements to keep insights aligned with shifting goals
- Hands-on training for your teams to explore and own the dashboards
The goal is – to make Power BI a long-term growth driver for you, not just a short-term fix.
Conclusion – Sales Wins Start with Data You Can Trust
In a world where speed and precision define competitive advantage, Power BI is more than a reporting tool—it’s a strategic sales ally.
With real-time monitoring, forward-looking forecasts, and cross-functional alignment, your teams gain the confidence to lead with data.
At Integrative Systems, we bring you more than Power BI sales dashboards—we bring sales intelligence with staying power.
Think we are the match you’ve been looking for? Drop us a line at contact@integrativesystems.com and our team of experts shall get back to you within 2 business days.
Ready to exploit the full potential of your sales data?
Let’s design smarter sales dashboards that drive smarter sales.
Frequently Asked Questions about Power BI Sales Dashboard
1. What is a sales dashboard?
Ans. Power BI sales dashboard is a visual representation of your sales performance metrics. It offers you a compact, bird-eye view of sales data points such as sales-to-date, sales-by-region, lead-to-conversion rate, sales performance, and so on so forth.
2. What is a Power BI Sales Dashboard?
Ans. Power BI sales dashboard is a visual interpretation that displays sales performance, KPIs, and other essential sales metrics. These dashboards are designed to empower decision-makers for faster & accurate decision-making.
3. How does Power BI help in sales analysis?
Ans. Power BI enables you to visualise sales trends, hidden shortcomings, and overall sales performance – all in one place. And this makes sales analysis with Power BI spot on!
4. How does Power BI for sales reporting benefit you?
Ans. Power BI sets you free from looking at clunky spreadsheets, and haywired sales data. It brings you all the data under one roof, and presents it in clear, intuitive, and interactive standards. This expedites your sales reporting accuracy and decision-making.
5. Is the Power BI sales dashboard customizable?
Ans. Power BI sales dashboards are customizable to the next level. You can customize your Power BI dashboards & reports as per your unique visualization needs, metrics, and layouts.


