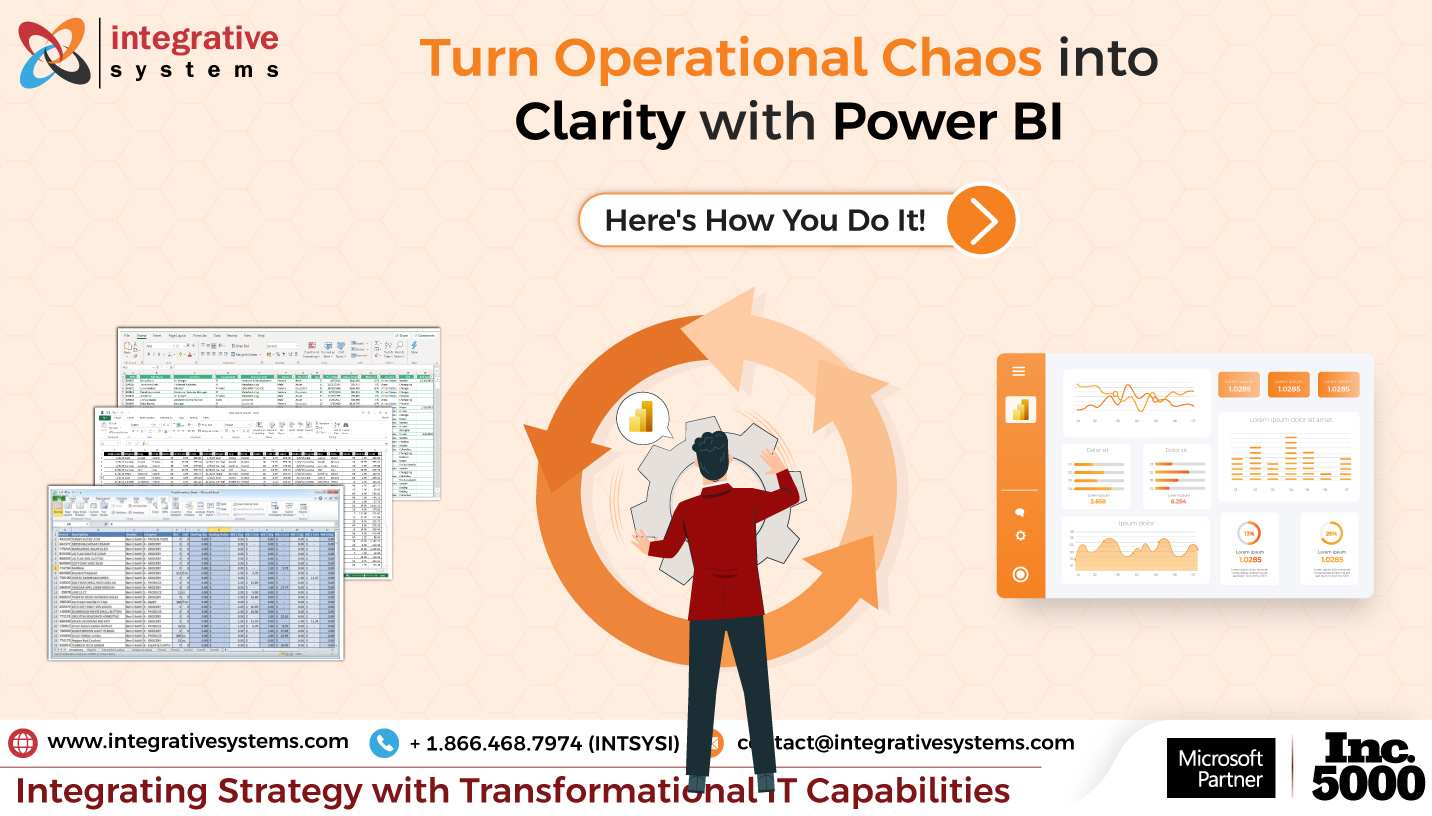
This company had it all – high-demand products, experienced staff, and a supply chain that was finely tuned over the years. But what lacked was clarity.
The COO of this mid-sized manufacturing firm knew her company couldn’t afford to slip. Yet, with growing product lines and complex vendor networks, her operations team spent more time reacting than refining.
One Monday morning, during the standard operational review, she glanced at a slide deck showing last week’s numbers – warehousing costs had surged.
Before she could ask why, her procurement head chimed in – “We ordered extra stock to compensate for last month’s delay.”
The finance head frowned.
The sales team looked puzzled.
Same data. Different stories.
That was the turning point.
The CIO proposed something radical – a Power BI operational dashboard tailored to their end-to-end operations, integrated with real-time feeds from ERP, procurement, warehousing, and sales.
In just six weeks, everything changed.
What used to take two meetings, and five email threads could now be answered on a single screen – updated by the minute. Delays, gaps, or opportunities – nothing is hidden.
The COO didn’t just gain a dashboard. She gained control.
And that’s the story of thousands of operational leaders who are now placing Power BI dashboards for operations at the core of strategic execution – transforming noise into action, and data into direction.
Thinking, “How do Power BI operational dashboards transform chaos into clarity?”
Let’s set the ball rolling!
Willing to Move from Operational Chaos to Clarity?
Let’s turn your lagging reports into actionable insights.
How do Power BI Operational Dashboards Transform Traditional Reporting?
Operations don’t happen in silos, and yet, most reporting structures do.
Procurement runs on manual trackers.
Finance uses their spreadsheets.
Sales rely on CRM reports.
And operations teams? They’re often stuck reconciling all of it.
That’s where Power BI operational dashboards make the difference.
Why is Traditional Reporting not Effective Anymore?
Static reports may tell you what happened – but never why or what to do next.
Strategic leaders need more than lagging indicators.
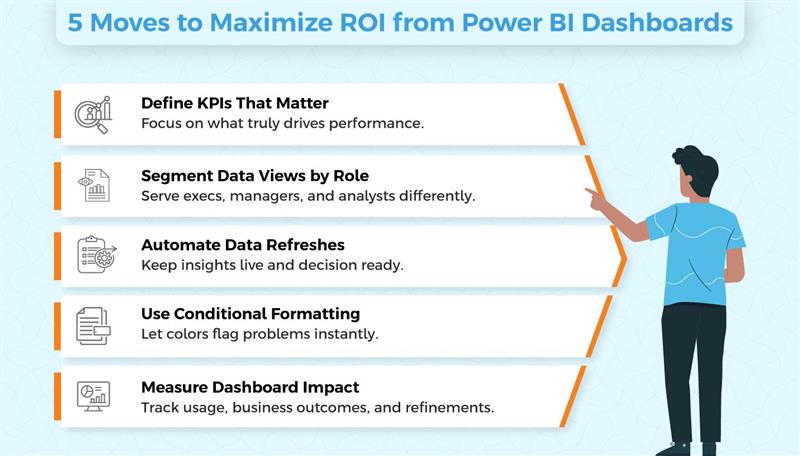
Power BI dashboard for operations allows you to –
- Connect data from multiple systems (ERP, CRM, SCM, IoT) into one real-time canvas
- Track metrics as they evolve, not days after they’ve already impacted performance
- Personalize insights by role, so your line manager sees workflows, and your VP sees trends.
Here’s how a comprehensive Power BI operational dashboard will function in real time.
Let’s take the example of a logistics company.
The team can connect its fleet GPS, warehouse inventory, and TMS into a single Power BI dashboard. What once took them hours of data prep can happen in real-time — enabling them to reduce freight delays, drastically.
How do Operational Dashboards in Power BI Help Make Quick Decisions?
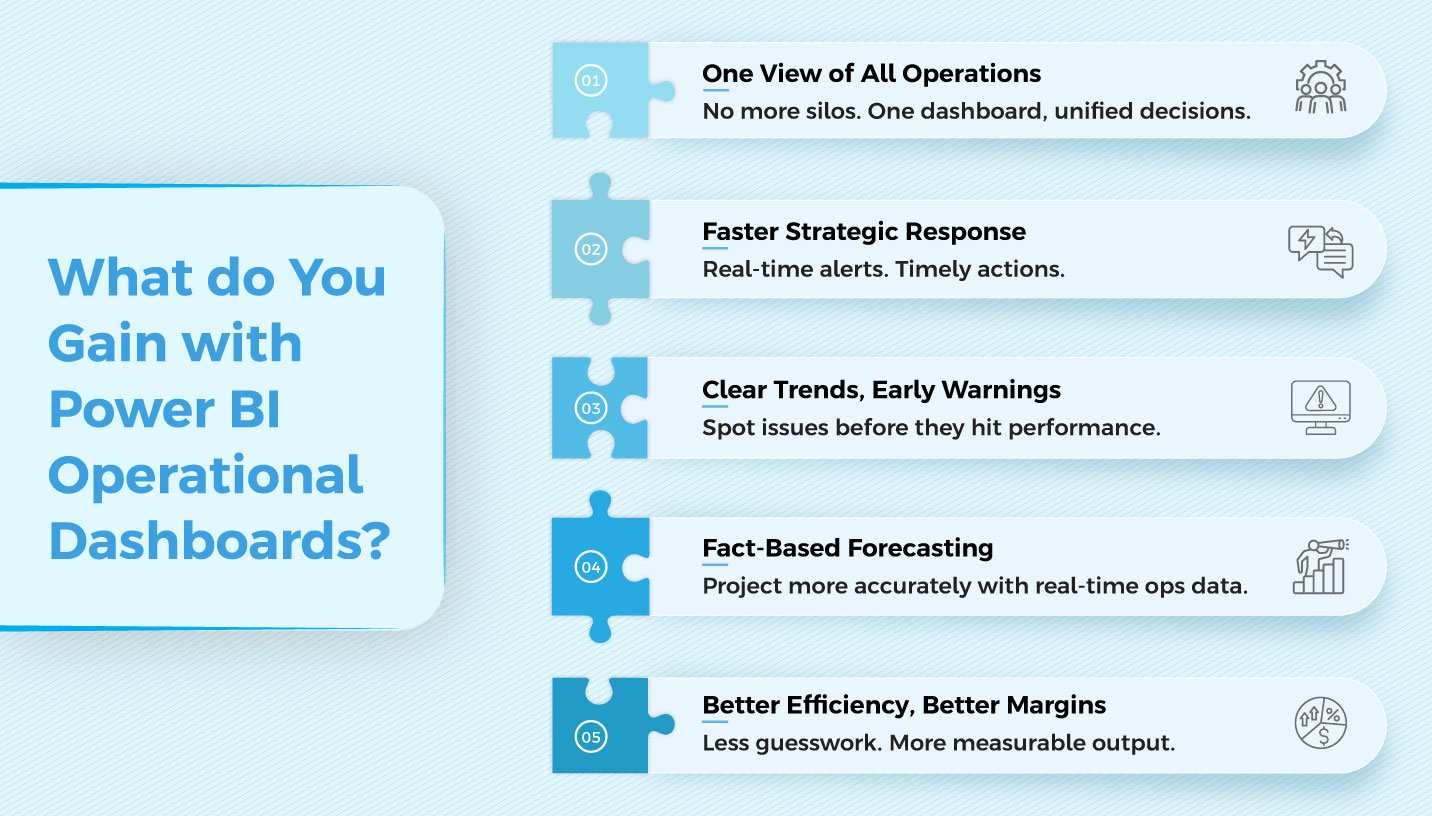
When done right, a Power BI operational dashboard isn’t just an IT asset — it becomes your operational nerve center.
Key features include –
Live KPI Monitoring
From production cycle time and order fulfillment to downtime and backlogs.
Drill-Down Interactivity
Move from macro view (e.g., weekly production output) to granular drivers (e.g., shift-wise machine utilization).
Predictive Triggers
Power BI can flag issues before they escalate. For example, if lead time variance exceeds 20%, procurement gets alerted.
Here’s how Power BI operations dashboard elevates decision making.
Let’s consider an example of a consumer electronics brand.
The team can use Power BI for operational reporting by connecting its MES and inventory systems. The dashboard would display machine performance, helping maintenance teams prioritize interventions. This can significantly reduce downtime incidents.
What Makes Power BI Ideal for Operational Reporting?
That’s the wrong question!
The right one is – “What’s at stake if I ditch Power BI for operational reporting?”
Scalability
Whether you’re tracking 100 SKUs or 100,000, Power BI handles it.
Security & Governance
Role-based access and Microsoft-grade security make it enterprise-ready.
Cloud & On-Prem Integration
Whether you use Dynamics, SAP, or homegrown systems, Power BI connects seamlessly.
And more importantly – it empowers your team to move from reporting to responding.
Still Running with Scattered Visibility in Operations?
Let’s turn operational inefficiencies into opportunities.
Next, let’s understand the role of Power BI operational dashboards in inventory management.
What do Power BI Inventory Dashboards Have to Offer?
While operational leaders often obsess over efficiency, inventory is where the real money is made – or lost.
Excess stock quietly eats into margins.
Stockouts silently erode trust.
And fragmented views often leave leaders playing a guessing game.
With a Power BI inventory management dashboard, you finally get the full picture – in real time, across all warehouses and SKUs.
Let’s understand how Power BI operational dashboards make a difference.
Power BI Inventory Dashboards – The Difference-Maker for Operations
An inventory Power BI dashboard doesn’t just visualize stock — it drives smart decisions.
Multilocation Visibility
Whether stock sits in Detroit, Dallas, or Delhi – see it all, now.
Forecasting Trends
Combine real-time movement with historical sales for predictive insights.
Replenishment Triggers
Set smart thresholds for reorder points, with visuals that grab attention.
Thinking, “How Power BI inventory dashboards work in action?”
Let’s understand that with an example of a furniture retailer.
Their in-house can use Power BI dashboards for inventory management by integrating sales trends with inventory positions. This would help them adapt to demand-driven replenishments. This single change would reduce the dead inventory and improve stock turnover.
Drill-Downs That Empower Teams, Not Just Executives
Beyond high-level summaries, your team can dig deeper.
ABC Analysis
Know which SKUs generate the most revenue and which ones slow you down.
Stock Aging Reports
Avoid wastage by prioritizing aging inventory.
SKU-Level Alerts
Color-coded flags for near-out-of-stock or overstocked SKUs.
Power BI dashboards for inventory are not just visual tools – they are operational control towers.
Thinking, “How do drill-downs work in action?”
Let’s decode that with an example of a healthcare distributor.
A healthcare distributor can have a Power BI dashboard for inventory management that tracks medical supplies across states. This unified inventory dashboard would offer them a clear visibility into stock, usage rates, and avoid expiry-related write-offs.
Inventory blind spots cost you more than just dollars!
Let’s make operational visibility non-negotiable.
Align Procurement with Real-Time Inventory
Your procurement teams can be only as good as the insights they have.
Power BI bridges the gap between inventory and procurement planning by –
- Highlighting high-velocity SKUs that need proactive ordering
- Flagging price fluctuations vs budgeted norms
- Identifying supplier performance trends
Inventory management dashboard Power BI solutions help align buying decisions with business realities – in real time.
Next, let’s understand how Power BI operational dashboards help forecast what is ahead of time.
How do Power BI Operations Dashboards Help Forecast?
Most operations teams are hardwired for efficiency – lean, fast, and accurate.
But operational excellence isn’t just about managing the present; it’s about anticipating what’s next.
That’s where Power BI for operational reporting goes beyond dashboards – stepping into the realm of forecasting and scenario planning.
From Lagging Metrics to Leading Indicators
Traditional KPIs tell you how you performed last week or month. While helpful, they do little to shape the next quarter.
Power BI changes that by integrating AI-driven forecasting models right into your dashboards.
Think –
- Forecasting production output based on current orders and workforce availability
- Predicting warehouse capacity usage based on sales seasonality
- Identifying supply chain delays before they hit your delivery SLAs
Thinking, “How effective forecasting with Power BI operational dashboards be?”
Let’s understand this with an example of a manufacturing company.
Their team can use Power BI to blend historical production data, current order pipeline, and raw material inflow. This would help them forecast output for the next 30 days – enabling them to adjust the labor schedules and resources in advance and meet SLAs well in time.
Willing to Move from Operational Chaos to Clarity?
Let’s turn your lagging reports into actionable insights.
Building “What-If” Scenarios in Real Time
With Power BI dashboard for operations, you no longer need to wait for a data analyst to model outcomes.
You can toggle assumptions directly on the dashboard.
Common use cases include –
- What happens if labor availability drops by 20%?
- How will revenue shift if we fast-track fulfillment in two regions?
- What’s the inventory risk if demand spikes during an unplanned event?
These aren’t just charts. These are levers – designed to give operations leaders such as yourself, the control in uncertain environments.
Supporting Agile Operations at Scale
In dynamic markets, rigid planning can become a bottleneck.
Power BI supports –
- Rolling forecasts, updated weekly or even daily
- Variance analysis, comparing actuals to multiple forecast models
- Driver-based planning, linking operational inputs to business outcomes
For COOs and VPs of Operations, this means you’re not just tracking performance – you’re shaping it.
Do you know what’s the best part of relying on Power BI operational dashboards?
They can be accustomed to your unique operational needs, and they grow as your needs do.
Next, let’s understand how customization works with operational dashboards in Power BI.
Custom Operational Dashboards that Speak Your Language
One of Power BI’s biggest advantages is that it doesn’t force you to adapt to the tool – it adapts to your business.
Whether you’re running a warehouse in Atlanta or managing supply chains across continents, Power BI operational dashboards can be tailor-made to speak your operational language.
Industry-Specific Power BI Operational Dashboards
Every industry has unique drivers.
Power BI enables the creation of role-based and industry-specific dashboards.
For Manufacturing
- OEE (Overall Equipment Effectiveness) tracking
- Downtime root-cause analysis
- Scrap rate analysis
For Retail & E-Commerce
- Stockout frequency and impact
- Fulfillment speed across regions
- Seasonal trend overlays
For Healthcare
- Inventory of critical supplies
- Bed utilization and turnover rate
- Supply-demand matching for essential equipment
Power BI Visuals That Drive Action
Operations move fast – and visuals must too.
Power BI operational dashboards empower you with –
- Color-coded alerts (green/yellow/red) to highlight performance gaps
- Dynamic charts that adjust based on filters like geography, product line, or channel
- Heatmaps and waterfall visuals to help identify patterns quickly
These aren’t just aesthetic upgrades – they fuel faster decisions, especially in war-room situations where every minute counts.
Collaboration & Governance Made Easy
Operational dashboards in Power BI often serve multiple layers of leadership.
Power BI makes it easy to –
- Share insights securely across teams
- Set role-based data access
- Embed dashboards into Microsoft Teams or SharePoint for contextual collaboration
So, your warehouse supervisor sees real-time stock levels. Your COO sees the big picture. And everyone moves together.
Power BI Operational Dashboards aren’t Nice-to-Have – But the Way Forward
Operational agility isn’t a luxury in today’s market — it’s your lifeline.
Whether you’re optimizing inventory, forecasting performance, or running agile war rooms, Power BI operational dashboards offer a single pane of clarity in a world of complexity.
They’re not just about tracking what happened — they’re about influencing what happens next.
And unlike traditional BI tools that require heavy IT overhead, Power BI puts the power back in your hands.
No more waiting for month-end reports.
No more guesswork.
Just live, actionable, enterprise-grade insights at your fingertips.
Strategic leaders don’t see dashboards as data. They see them as direction.
So the question isn’t whether your operations need Power BI. The real question is – can you afford to operate without it?
Need help building operational dashboards in Power BI?
Need help training your in-house team in optimizing Power BI performance?
We, at Integrative Systems, have been in the industry for more than 2 decades and have been serving our clientele in the BI space for more than a decade now.
Our goal is to help our customers succeed first as an extended team offering round-the-clock support, full stack expertise, and talent-on-demand.
Think we’re the match you’ve been looking for.
Drop us a line at contact@integrativesystems.com and our team of experts will reach out to you within 2 business days.
Still Running with Scattered Visibility in Operations?
Let’s turn operational inefficiencies into opportunities.
FAQs – Power BI Operational Dashboards
1. How does Power BI improve operational reporting?
Ans. Operational dashboards in Power BI allow you to consolidate dispersed data across systems and offer real-time visibility into operations so that you can catch the trends, positive or negative, to adapt quickly.
2. Can Power BI really help with inventory management?
Ans. Yes. Power BI inventory dashboards bring you real-time, uniform visibility into stock levels and allow you to set up alerts. An inventory dashboard ensures you never end up overstocking or running out of stock.
3. What business value does Power BI bring to operations?
Ans. It’s not just about pretty charts. Power BI empowers your team to make confident, data-backed decisions—faster. The result? Less guesswork, more growth.
4. Can these dashboards be tailored to our unique operations?
Ans. Yes, completely. Power BI dashboards can be customized to reflect your KPIs, workflows, and priorities—so you get insights that are actually relevant to your business.