Data, it’s just a 4-letter word. But it’s at the core of everything we do.
Businesses today have data on –
- Customer’s sentiments
- Customer’s buying journey
- Customer’s behavioral patterns
- Shifting demand & market dynamics
And, what not?
There is almost nothing that they don’t have data on.
But raw data is as useless as a blank sheet of paper.
Fortunately for you, there exists Microsoft Power BI – a handy business intelligence tool.
- Heard of Power BI?
- Curious if this popular BI tool is right for you?
- What exactly is PowerBI, and is all the hype it’s been getting of late worth it??
Relax!
You don’t need a degree in Computer Science or the phone number of Bill Gates to understand MS Power BI – Simply follow Integrative Systems’ (unbiased) comprehensive guide.
This guide gets you answers to the following questions:
- What is Power BI Software?
- What is the market status of Power BI?
- What is Power BI Architecture?
- What is Power BI Used for?
- What are the Power BI Licenses and Power BI pricing?
- What are the Pros and Cons of Power BI?
- Who are the Top Power BI Consulting Services providers in the USA?
Contact us for Power BI Consulting
Let’s get going to make the most of your time here.
Looking Beneath the Hood – What is Power BI, exactly?
Power BI Software is a self-service business intelligence platform provided by Microsoft for dissecting and visualizing raw data into actionable insights.
Power BI means Power Business Intelligence.
As per Microsoft, over 5 million subscribers are embracing Power BI for business, including lone professionals, data scientists, decision-makers, and frontline workers to gain actionable business insights in a few taps (with minimal training).
Wherever your data might be – on-premises, in the cloud, in hybrid data warehouses, or across distributed databases—Power BI has got it covered.
Put simply: MS Power BI empowers your users (technical & non-technical) to explore and analyze data themselves, democratize access to actionable insights, and promote a data-driven culture within your organization.
Thinking, why is there so much hype about Power BI? Let’s figure it out.
What’s with Power BI Hype?
Here are some numbers that justify Power BI’s market standing:
- Microsoft Power BI claims a 13.62% market share in the BI market ~ confirms Enlyft
- Of all businesses that are using PowerBI Microsoft, 46% are small (<$50M in revenue), 21% are medium-sized and 28% are large (>$1000M revenue) ~ as per Enlyft
- Microsoft has been recognized as a Leader in Analytics and Business Intelligence Platforms by the Gartner Magic Quadrant for the 16th consecutive year, reaffirming Power BI’s crucial role in the industry ~ According to Microsoft.
- Currently, over 100,000+ businesses including Fortune 500 companies are using Power BI for business ~ Confirms Microsoft.
With these compelling figures and the strong market standing of Power BI, it’s confirmed that all the hype it’s been getting lately is worth it.
But how is Power BI cooking all this magic?
Up next, let’s understand Power BI Microsoft’s architecture for clarity on how it works.
MS Power BI Architecture, Explained
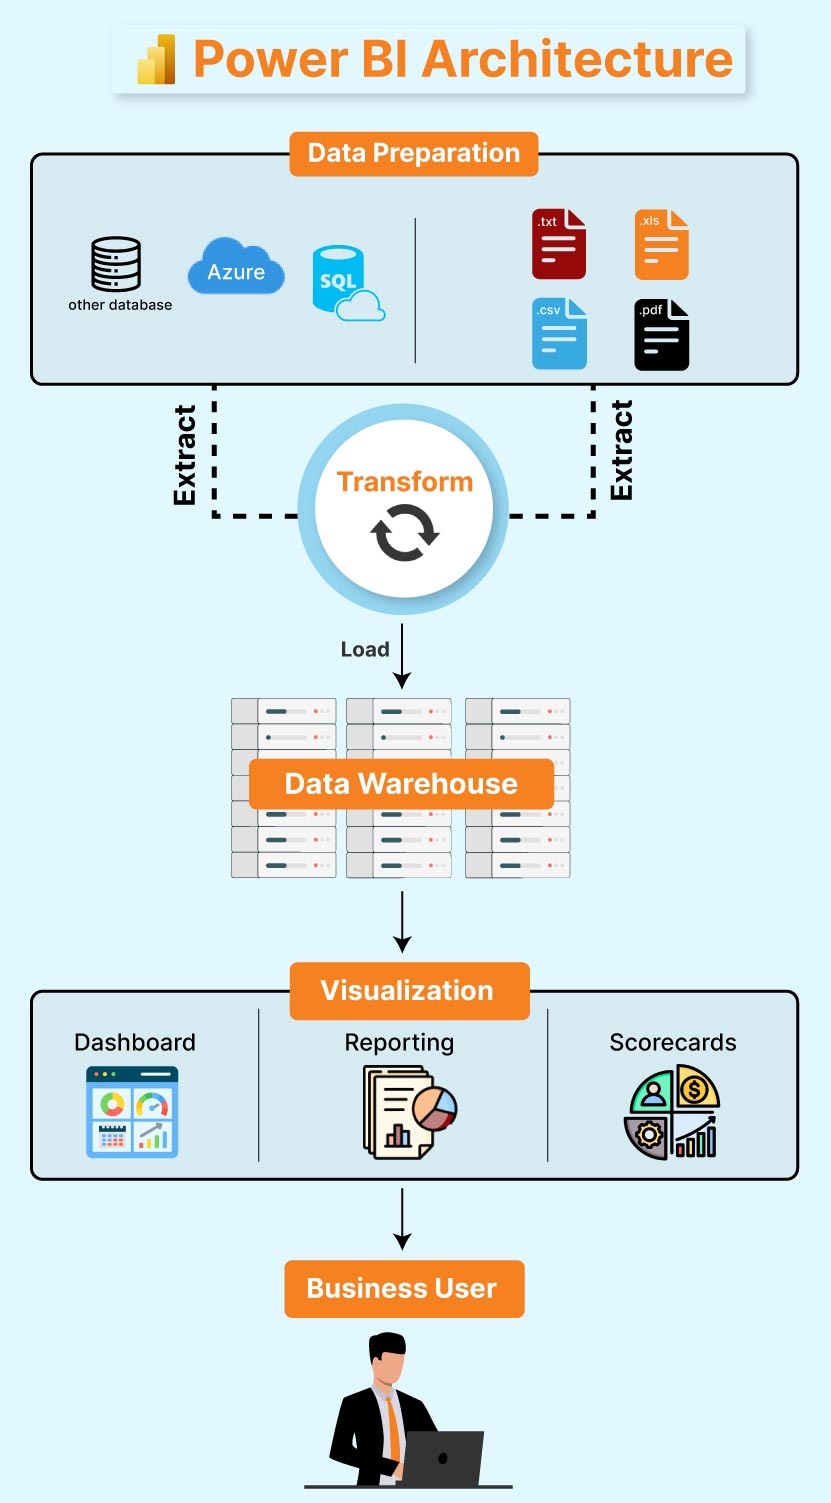
MS Power BI architecture is a service built on Azure architecture.
Various technologies and processes are combined to offer impeccable PBI results.
Let’s zoom into the process further.
Data Sourcing
Power BI sources data from various sources directly to the system or a live service link to receive it.
There is a data limit if you want to import the data directly in Power BI. Post you hit the limit; you can only run live queries on datasets.
Data Transformation
Next, in data transformation, the process of cleaning and preprocessing data takes place.
This means removing useless data or missing values from columns and rows.
Post that, certain rules are applied to transform and load the datasets into the warehouse.
Report and Publish
After cleaning and transforming the data, reports are created with multiple filters to present insights.
4. Creating Visualizations
Finally, after publishing the reports to MS Power BI services, you create dashboards by pinning live report elements for interactive data exploration and analysis.
You can stay connected to your data anywhere, anytime using the Power BI application for Android, Windows, and iOS platforms, or the Power BI Mobile App,
This offers a behind-the-scenes picture of the Microsoft Power BI architecture.
Wondering – “But how does Microsoft Power BI service help my business succeed?”
Now, as you’re aware about how Power BI works, let’s explore the various ways Power BI proves invaluable for your business.
Why Business Leaders Are Investing in Power BI? And You Should Too?
Microsoft Power BI software is widely used by industries and businesses, including manufacturing, healthcare, retail, finance, and others.
Thinking why are leaders attracted to Power BI the most, despite the availability of robust BI tools in the market?
Here’s why:
Affordability
Microsoft business intelligence tool is one of the least expensive BI tools available in the market, starting from $10.
Additionally, businesses with limited business intelligence needs can opt for the free Power BI Desktop version, which is free for lifetime.
Integration
Businesses these days call for effortless integration of their BI tool with other systems and data sources.
Power BI Microsoft excels in this area by offering seamless compatibility with a wide variety of data sources, applications, and services, ensuring that data is easily collected, analyzed, and visualized within a single platform.
Query Processing
One of the best features of Power BI platform is – it’s a natural language query tool.
Instead of manually searching through data, this PBI feature allows you to interact with your data.
For instance, you can simply ask your data like” Top 10 Customers of 2024?” and you get customized visuals as the answer to your question.
Sounds impressive, right?
Visual Customization
Power BI is a super versatile reporting tool when it comes to importing customized visuals. Plus, it’s simple drag and drop features, which makes it an ideal business reporting tool for experts and beginners alike.
Embedded Analytics
One of the best features of Power BI Microsoft is its ability to embed reports directly in web pages. With many ways to filter, interact, or drill into the data there are several ways to create interactive stories and narratives for published reports.
Multi-Connection Data Source
Most of the top data analytics and business intelligence tools lack support for multiple connectors.
However, Power BI stands out by offering multi-connection data sources, as it is supported through Power Gateway to refresh on Power BI Services.
Past, Current, and Future, All Together at Once
While it’s impossible to know the future, Power BI’s data modeling helps you predict the future.
It enables you to run scenarios of your present and possible future states to see the potential outcomes.
For instance, if you implement a new strategy, how will it impact your business?
Power BI helps you see the past and current world – and plan well for what’s coming next.
Enhance Customer Experience
Consumers are willing to pay a 16% price premium for a great customer experience ~ According to PwC.
In today’s customer-centric landscape, Power BI helps you improve customer experience.
Staying a step ahead of your customers’ needs is essential for every thriving business.
From seamless integration with CRM systems, Outlook, and social media to tracking workflow completions, Power BI Microsoft helps you anticipate and meet customer demands effectively.
For instance, it helps you with – when was the last time that a customer placed an order? How long since they last replied?
Power BI Security
Power BI automatically encrypts persisted data using keys managed by Microsoft by default. Plus, you are in complete control of who sees and views your reports.
If you’re looking for an easy to adapt, easier to learn, and easiest to use BI platform in 2024 – Microsoft PowerBI is just the right pick.
Yet, if you feel…
- Power BI is hard to implement
- It is harder to train the BI team
- And it’s hardest to make the most of MS Power BI’s robust features
You can use the help of a professional Power BI consulting service provider who helps you make the most of PBI and stay ahead of your rivals.
Realize, Power BI is a full-package data analytical tool. Microsoft offers Power BI with a variety of subscription plans to match the convenience and needs of your business.
And your BI success hinges on your choice of correct Power BI pricing plan.
Wondering which Power BI product will drive maximum ROI for your business?
Now, let’s look at different PowerBI products and Power BI pricing plans to understand what suits your needs better.
Power BI Versions – What’s the Difference?
Microsoft Power BI business intelligence is more than just a report creation tool.
It comes in as an infrastructure that allows you to publish reports that you can share and collaborate with other PBI users.
Microsoft offers 2 options for doing so:
- Power BI Service, cloud-based platform
- Power BI Report Server, an on-premises server
The Power BI Report Server runs on a hybrid approach to implementing Power BI, bringing you the best of both worlds. So that you can utilize both on-premises and cloud platforms together.
| Platform | Infrastructure | License | Mobile reports | Dashboards | Q&A | Real-time streaming |
| Power BI Service | Cloud | Power BI Pro and/or Power BI Premium
| Yes | Yes | Yes | Yes |
| Power BI Report Server | On-premises | Power BI Premium or SQL Server EE with Software Assurance (SA)
| Yes | No | No | No |
Next, here’s a comparison of Power BI services – Power BI Free Cost vs. Power BI Pro Cost vs. Power BI Premium Cost.
Power BI Desktop
This PowerBI version is for users who want to step into the dynamic realm of Power BI or businesses with limited BI requirements.
| Version | PowerBI Price | Deployment |
| Power BI Desktop | $0.00 for lifetime | On-premises |
Power BI Pro
This version of Microsoft BI is tailored for startups and mid-size organizations, or users with advanced BI requirements, offering advanced collaboration, sharing capabilities, and access to additional data sources.
| Version | Microsoft Power BI Price | Deployment |
| Power BI Pro Per User | $9.99 | Cloud |
| Free with Microsoft 365 E5 licenses |
Power BI Premium
This Microsoft PowerBI version is meant for mid-size businesses and enterprise-level organizations, with the requirement of high productivity, seamless collaboration, and advanced analytics.
| Version | Microsoft Power BI Pricing | Deployment |
| Power BI Premium Per User/Month | $20.00 | Cloud |
| Power BI Premium Capacity/Month | $4,995 | Cloud |
Power BI Mobile
This version of Power BI is optimized for mobile devices, allowing users to access, interact with, and explore Power BI reports and dashboards conveniently on the go.
| Version | Power BI for Business Pricing | Deployment |
| Power BI Mobile App | $0.00 | Smartphone/ Tablet |
Power BI Embedded
This Microsoft Power BI version is a Power BI Premium component that allows users to embed Power BI content such as dashboards and reports, directly into their applications.
| Power BI Embedded Node type | Power BI Embedded Pricing | Deployment |
| A1 | $1.0081/hour | Cloud |
| A2 | $2.0081/hour | Cloud |
| A3 | $4.0242/hour | Cloud |
| A4 | $8.0565/hour | Cloud |
| A5 | $16.121/hour | Cloud |
| A6 | $32.2506/hour | Cloud |
Power BI Report Server
This PowerBI Microsoft version is designed as an on-premises physical server dedicated to businesses, allowing them to manage and distribute Power BI reports securely within their organization.
| Version | Microsoft Power BI Cost | Deployment |
| Power BI Report Server | Free with SQL Server Enterprise OR Free with Power BI Premium P1 | On-premises |
We’re confident that this comprehensive comparison answers your question: How much does Power BI software cost?
But since Power BI software comes with multiple versions, which Microsoft Power BI version is better for your BI needs? – yet another puzzle to decode!
Relax! An expert Microsoft Power BI consultant has answers to all your questions.
But despite its robust capabilities Power BI business intelligence is not without its set of challenges.
Thus, we bring you the good and bad of Power BI to fast-forward your decision-making process.
Moving on, let’s explore the pros and cons of Power BI.
What are the Advantages and Disadvantages of Power BI Business Intelligence?
Exploring the good and bad of Power BI will help you understand the tool better and determine if it’s the right fit for your needs.
Let’s go!
| Power BI Pros | Power BI Cons |
| Wide variety of visualization and customizations | Confusing licensing |
| Support for multiple data sources and formats | Expensive to scale |
| Advanced Machine Learning and Data Analytics Capabilities | Steep learning curve for advanced features |
| Native R Integration | No report sharing in PowerBI Free |
| Robust security measures | Limited capabilities with PowerBI Desktop version |
| Vibrant user community | Unreasonable cost for Microsoft Power BI Premium |
| Detailed resources and documentation | Higher dependency on Microsoft product offerings |
| Free trial | Custom code limitations |
| Microsoft backing | Online-only functionality |
| Both cloud and on-premises storage options | |
| Free version | |
| Natural language query engine and Cortana integration | |
| MS Power BI Mobile for on-the-go sharing | |
| Effortless collaboration | |
| Cost-effective than most BI tools | |
| Rich personalized dashboards | |
| Excel integration | |
| Regular updates |
We know what you’re thinking! There are more cons, but the list of pros is non-ending.
That’s what makes Power BI the most favored BI tools for the decision-makers.
Now, as you decide on your investment in Power BI, do consider your data scope, reporting needs, budget, and ecosystem to decide whether Power BI’s cons override its pros.
Pro tip – Instead of deciding on your own, it’s ideal to consult a BI consulting solutions provider specializing in this field.
You may start to think – “Why are we chanting Power BI consulting and development services since the beginning?”
Well, without triggering your curiosity any further, let’s get straight to the point – why opting for Power BI professional services is always worth it?
Your Power BI Investment is Waste Without a Power BI Consultant – Here’s Why!
Hands down, there is nothing easier and simpler than Microsoft Power BI implementation.
But, when you have a Power BI Partner, who knows the ins and outs of Power BI to support your BI initiative, you make the most out of it.
Power BI consultants sleep over the Power BI features and updates and strive to make the most of it for you.