Imagine this.
You’re sitting in a quarterly review, and your team is trying to make sense of fragmented reports—Excel sheets in one tab, slides in another, KPIs jotted down in notes.
The numbers don’t align.
The insights are delayed.
The decisions await, forever.
The story? Incomplete.
Now picture this instead.
You walk into that same meeting, but this time, the dashboards are live. Trends are updated in real time. Data flows seamlessly from finance, operations, sales—even from legacy systems. You’re not just looking at reports. You’re seeing the story unfold.
That’s the difference Power BI brings to the table.
For strategic leaders, Power BI isn’t just a reporting tool—it’s a decision-making catalyst.
Sure, Excel got you this far.
But if you’re serious about scale, agility, and uncovering deep insights without chasing data around the org—Power BI is your ally.
The challenge?
Most leadership teams are only scratching the surface. They’re missing the real power of this platform—because they aren’t aware of its full capabilities.
That’s why we’re breaking it down for you.
We’ve created a clear, value-focused walkthrough of Power BI’s top features and benefits—designed to help you unlock smarter analytics, better forecasts, and sharper business moves.
But first, let’s quickly rekindle why modern analytics and BI are indomitable in the modern business landscape.
Let’s begin.
READY TO MAXIMIZE YOUR POWER BI?
Why Are Data Analytics and Business Intelligence Important?
Data analytics and business intelligence are effective data management solutions implemented in enterprises and companies to collect and represent data using sophisticated software and statistics for analysis for improved decision-making.
Data analytics can help businesses turn large, unstructured data into a meaningful structure and relationship set. It empowers you to make well-informed, data-driven decisions, well in time.
Data analytics translates raw data into actionable insights. Power BI is a complete tool to streamline your data cleansing, data visualization, and data management.
Not adapting to data analytics would cause not being able to identify relationships or patterns from raw data.
Next, look at some of the key benefits of using Power BI for your data & business intelligence needs.
Power BI Benefits for Your Organization
Multiple businesses want to gain reporting and analytics power to boost their data analytics strategies. Microsoft Power BI can help your business to go beyond the Excel capabilities and reach the next level of business intelligence.
Power BI benefits can help you scrutinize, assemble, and visualize company data to gain better insights into your business operations and performance. The data analytics software enables professionals to make effective decisions using different metrics for better results.
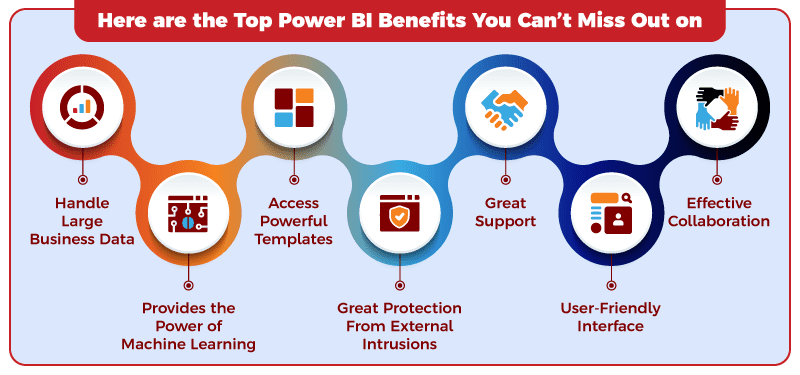
Here are the top Power BI benefits you can’t miss out on –
1. Handle large business data
Power BI benefits for organizations with large data sets are immense. It can handle huge datasets, process them, and convert them into meaningful insights your business management team can understand for better decision-making.
Other data intelligence and business analytics software struggle to handle the large data inputs and deliver disorganized results to hinder your outputs.
Microsoft’s Power BI helps organizations to create bars, charts, and other data representation formats for a detailed and better understanding of the datasets.
2. Provides the power of machine learning
Microsoft Power BI allows organizations to explore the power of intelligence and machine learning. It offers multiple data analysis features and lets you pinpoint valuable trends for better and more accurate predictions.
It can adjust your raw business data to help the business analyst understand the data insights and use it for business success.
You can use different features that deliver instant results because of machine learning capabilities integrated into the software.
3. Access powerful templates
Power BI provides users with powerful and effective templates to visualize the information to extract more value from the organization’s data. You can also work on the white plane space, use existing templates, or load your dataset into different representations to create well-vetted Power BI reports.
The data analytics tool lets you edit your reports’ text, image, size, and elements using powerful features and creates the most intuitive and clear reports from your datasets.
4. Great protection from external intrusions
You can protect your Power BI reports dashboards and datasets using the reliable protection provided by the data analytics tool. Share your Power BI reports across your organization or in the outer circles of your organization. It can stay protected from different threats and attacks in the digital world.
You can export your Power BI reports to different file formats like PowerPoint, PDF, Excel, etc., without compromising the security of the files.
5. Great support
Power BI provides good assistance in making data-driven plans and decisions, as it offers 500+ free connectors for its users. You can connect and communicate with hundreds of cloud data sources and on-premise sources like Azure SQL Database, Excel, Salesforce, SharePoint, and Dynamics 365.
Microsoft also offers partner businesses to provide consulting services and knowledge to help you with a better report-creating process and management.
It also offers a robust support network, community forums, and other support resources to streamline your reporting process and achieve better business outcomes.
6. User-friendly interface
Power BI tool offers a user-friendly and intuitive interface to enable the users to navigate different functionalities and use the wide range of features available.
You can handle the complexities and don’t require in-depth technical knowledge to handle the basic features of the software to streamline your business operations.
A simple report-making process can deliver the best-tailored reports for the available business datasets. The data intelligence tool channels the data analyst team to understand valuable insights.
7. Effective collaboration
You can use the benefits of Power BI Pro to collaborate with other Power BI users and improve your data analytics and business intelligence process.
One of the powerful Power BI Pro benefits is the coloration features that separate it from the Power BI desktop. You can distribute reports and visualization to multiple other Power BI subscribers to ensure data analysis for making informed decisions.
Power BI Pro enables users to embed Power BI visuals for multiple Power BI apps, integrate with leading Microsoft solutions and data, and share dashboards and reports with other Power BI users to create different workspaces.
You can also collaborate on different reports and enable peer-to-peer sharing. The Power BI Pro can also help you share published reports and dashboards outside your business environment with users who have the certified license of the tool.
These benefits can skyrocket your business growth and streamline the data analytics workflow. Now let’s check the effective Power BI features.
Next, let’s understand how Power BI services provider has a role to play in making Power BI a success for you.
How does Power BI Partner Help Make Most of Power BI?
Modern enterprises don’t just run on data—they grow because of it.
And Power BI, when implemented right, becomes more than a reporting tool—it becomes a strategic compass.
At Integrative Systems, our Power BI consulting services go beyond dashboards—we build business intelligence engines that empower every department, across any industry.
Let’s explore four high-impact, real-world use cases that show how Power BI delivers measurable business value—across sectors and across the boardroom.
Retail – Inventory Optimization & Customer Insights
Problem
A US-based Retail chain was struggling with frequent stockouts and dead inventory across 100+ locations.
Sales data, footfall trends, and supplier reports were spread across disconnected legacy systems.
Solution
With our Power BI integration services, we helped them connect ERP, POS, and warehouse systems to deliver a unified dashboard covering real-time stock levels, location-based sales patterns, supplier delivery metrics, and predictive restocking models.
Result
As a result, they were able to attain –
- Automated reordering processes
- 18% reduction in inventory overheads
- Improved visibility into slow-moving SKUs
- Personalized promotions based on buying behavior
- 2X improvement in customer satisfaction scores during peak season
Power BI business solutions helped them go from reactive stock management to predictive merchandising—at scale.
Manufacturing – Downtime Reduction with Predictive Maintenance
Problem
A US-based Automative Manufacturing company was struggling with unplanned downtime leading to $1.3M losses annually.
Machine performance data existed but was underutilized due to poor visibility and manual tracking.
Solution
Through custom Power BI solutions, we built a real-time operational dashboard that tracked vibration patterns, temperature thresholds, and maintenance cycles across critical equipment on the shop floor.
We also configured alerts for anomaly detection and failure prediction.
Result
As a result, the plant was able to achieve –
- 30% reduction in unplanned downtime
- 25% increased equipment utilization
- Proactive maintenance schedules
A comprehensive Power BI dashboard solution transformed their machine logs into million-dollar savings.
READY TO MAXIMIZE YOUR POWER BI?
Healthcare – Patient Flow & Clinical Efficiency Optimization
Problem
A multi-specialty hospital group was lacking visibility into patient flow across departments, causing long wait times, resource underutilization, and inefficient appointment scheduling.
Solution
We leveraged Power BI for business intelligence to create a 360° patient flow dashboard.
It monitored wait times, appointment cancellations, treatment durations, bed occupancy, and physician load in real-time—feeding data from their EMR and hospital management systems.
Result
As a result, the Hosptial was able to attain –
- Proactive resource allocation
- 22% reduced average patient wait time
- Improved doctor-patient load distribution
- Streamlined patient care & bottleneck identification
With Power BI implementation services, the healthcare leaders were enabled to visualize inefficiencies and act faster—for both patient outcomes and operational gains.
Finance & Compliance – Risk Reporting at a Global FinTech Firm
Problem
A FinTech organization handling B2B credit services across North America and Europe was struggling with fragmented financial data, regulatory risk, and manual reporting processes that consumed entire teams.
Solution
By deploying Power BI business solutions, we automated financial reporting workflows, integrated global regulatory compliance dashboards, and implemented real-time risk scoring tied to account activity and exposure thresholds.
Result
As a result, they were able to attain –
- 23% improved risk event detection
- 40% reduction in manual reporting hours
- Improved audit-readiness with regulator approved templates
Power BI consulting services empowered the financial leaders to shift from compliance chaos to control and clarity.
Next, look at the top features of Power BI that may prove to be game changers for you.
READY TO MAXIMIZE YOUR POWER BI?
Power BI Features for Data-Driven Decision Making
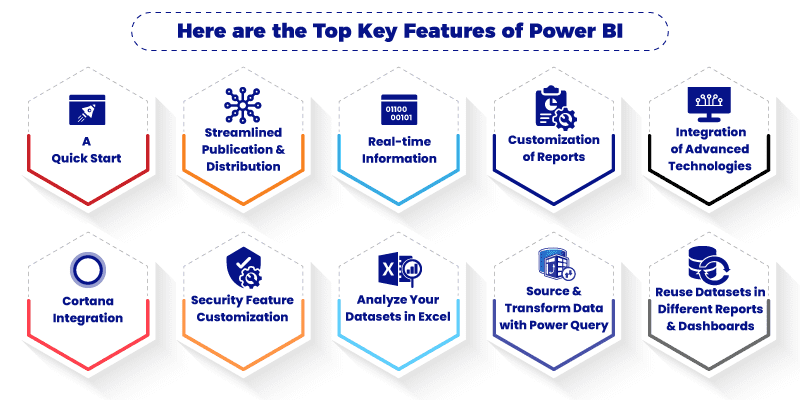
The quick and reliable data analytics tool offers great features to help you optimize your business operations and minimize the hassles. Here are the top key features you can use.
1. A quick start
You can get insights because of the uncomplicated setup of the software to increase its efficiency and easy usability. You don’t require prior training to access multiple features of the software. Basic knowledge of using Excel can be effective and assist you with optimum use of Power BI.
You can also access the dashboards of different services like Google Analytics, Microsoft Dynamics, and Salesforce.
2. Streamlined publication and distribution
Data analysts or professionals can upload the created visualizations and reports in the Power BI Service without emailing or putting the large files in the shared drive.
If the user changes, the data can be updated easily, and there will be no requirement for uploading or changing the reports.
3. Real-time information
The updates in Power BI happen in real time once the data is pushed in or streamed. The real-time update feature lets users quickly solve problems and identify new opportunities.
Reports or dashboards can update and display real-time visual and data changes, enhancing the Power BI report quality.
Multiple streaming data sources, like factory sensors, social media, or other time-sensitive data sources, can be collected and transmitted in real-time.
4. Customization of reports
Microsoft Power BI offers different editing features to assist you in building and customizing your Power BI reports from scratch.
You can create intuitive reports to help the viewers quickly understand the relationship between multiple data points and filter out valuable insights or trends to help solve the problem.
You can modify and share your Power BI reports to achieve your desired business outcome and extract the best results from the well-vetted reporting system.
5. Integration of advanced technologies like AI and ML
Microsoft Power BI can access image recognition and text analytics, integrate seamlessly with Azure Machine Learning, and create different machine learning models to help the user make the most of the advanced technologies.
You can unlock great data visualization and analytics results to achieve new business heights and streamline your operations.
6. Cortana integration
Power BI can coordinate with Microsoft’s digital assistant, Cortana, and provides users to ask queries in natural language to access charts and graphs. The feature is highly beneficial if you use a mobile device to minimize the time and effort and ensure you unlock the best data analytics results.
7. Security feature customization
During your report creation, you can set up row-level security (RLS) access filters in the Power BI tools to ensure the viewers can only view the relevant data.
It minimizes the risk of people viewing confidential data only for the higher management authorities. You can also limit viewing access to selected individuals to ensure no third-party involvement.
8. Analyze your datasets in Excel
Excel is the world’s number one data analysis tool. You might require an Excel export of the data displayed in dashboards and reports.
You can utilize the Power BI pro benefits to get flexibility while maintaining the integrity of the connected reporting environment.
Microsoft released Analysis in Excel, where Excel is connected to your underlying Power BI data. You can perform tabular and ad hoc reporting. You can also create PivotTables in Excel and use the familiar experience to edit your data, referencing the same datasets used in Power BI reports.
You can get the latest data from Power BI datasets by freshening up the Excel connection. The ease of access can be a game changer for your organization if you are stuck between two platforms.
9. Source and transform data with Power Query
Power BI can help you easily import and transform data from different sources using Power Query if you struggle to pivot, join, and filter your data. It is designed to be a low/no-code data analysis tool, so analysts without programming or SQL knowledge can transform, manipulate, and join their data with a simple and easy-to-use interface.
Connect to databases or files, choose from multiple pre-built SaaS connectors or connect to the cloud and on-premises databases like SQL Server, Redshift, BigQuery, and Snowflake.
10. Reuse datasets in different reports and dashboards
Aligning a single version of the truth across different reports can be challenging and may often end with inconsistent definitions of KPIs and metrics. But Power BI can define measures in a data model and re-use the calculations across different connected reports.
By keeping your KPS calculations in a central dataset, you can ensure “Sales Revenue” and “Gross Profit” return the same numbers, irrespective of which report you’re viewing.
It differentiates Power BI from other data visualization tools that define KPIs in each report separately.
These Microsoft Power BI features can help you improve the data representation and analytics task to boost your business operations and handle different business difficulties.
But you need professional help and support to help you achieve the desired outcomes of Power BI.
READY TO MAXIMIZE YOUR POWER BI?
Why Choose Integrative Systems as Your Power BI Services Provider?
We at Integrative Systems can provide you with the best Power BI management to help you unlock your desired goals and achieve better results.
As one of the country’s best Power BI consultation service providers, we understand your business requirements and needs.
Our talented team of experts has the experience and knowledge to deliver you the best Power BI outcomes tailored for your organization.
Get started with advanced BI reporting, professional expertise, and Power BI consulting team support for transforming your business data analytics and business intelligence approach.
Boost your operational efficiency and access the interactive Power BI Dashboards to reach the maximum potential of using Power BI.
We offer powerful and detailed Power BI Analysis reports for your business operations to improve your decisions. You can access the dashboards anytime, anywhere, with Power BI mobile.
Connect with the experts at contact@integrativesystems.com
READY TO MAXIMIZE YOUR POWER BI?






One Reply to “Benefits of Using Power BI for Business Intelligence”
James Taylor
Power BI is a game-changer for business intelligence! It offers powerful data visualization, real-time insights, and easy integration with multiple data sources—helping businesses make smarter, data-driven decisions.